Quick answer: A traffic control center LED display should be designed around operator decisions, not screen size alone. The essential factors are content and source mapping, viewing distance, pixel pitch, total resolution, brightness, refresh rate, signal processing, redundancy, maintainability and acceptance testing. For a 24/7 control room, the complete signal and power chain must be engineered as one system.
Traffic management centers combine CCTV feeds, incident alerts, GIS maps, traffic flow data and dispatch communications. A fine-pitch LED video wall can present these sources on one seamless canvas, but only when the display specification matches the room, the workflows and the reliability target. This guide explains the design choices that matter and gives practical criteria for procurement and acceptance.
What is a traffic control center LED display?
A traffic control center LED display is an indoor, direct-view video wall used to visualize live transport operations. Unlike a roadside variable-message sign, the control-room wall is viewed at close range by operators and supervisors. It therefore prioritizes fine pixel pitch, readable text, stable low-brightness performance, consistent color, wide viewing angles and continuous operation.
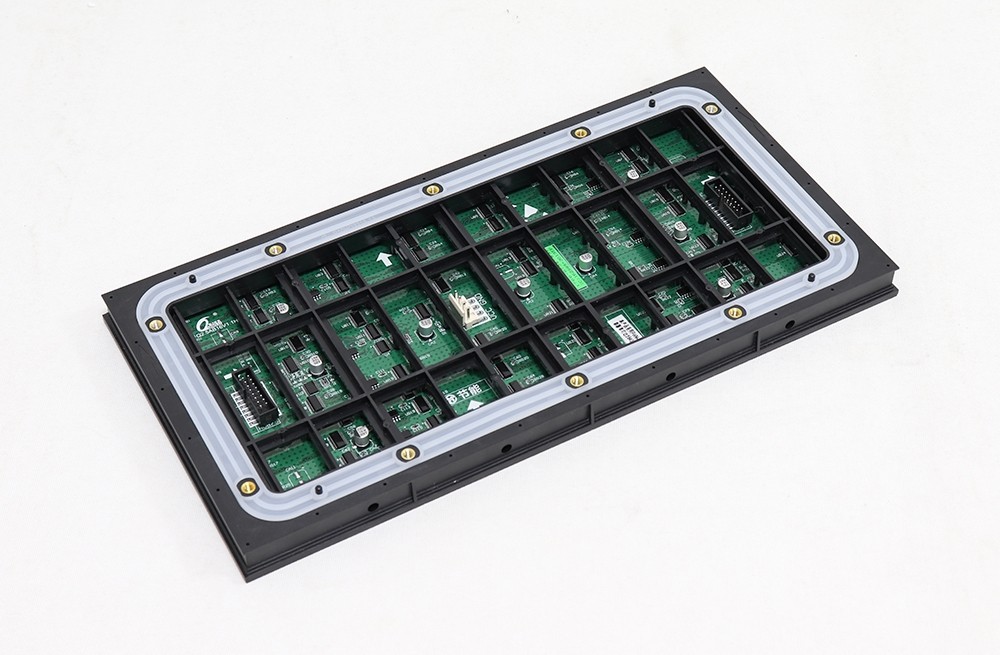
The display is one layer in a wider command-and-control system. Cameras, traffic sensors, servers and operator workstations provide sources; decoders and a LED video processor arrange them; sending and receiving cards distribute the video data; LED modules form the final canvas. Monitoring software should report the health of critical devices rather than treating the wall as an isolated appliance.
9 traffic control center LED display design factors
1. Define operational goals and the content matrix
Start with the decisions the room must support. List every source, its native resolution, frame rate, security level, owner and priority. Then define normal, incident and emergency layouts. A wall used mainly for maps has different requirements from one showing dozens of moving CCTV feeds.
- Identify the maximum number of simultaneous windows.
- Reserve fixed zones for alarms, maps, video and status information.
- Define who can change layouts and which sources may be shared.
- Specify recovery behavior after a processor, network or power interruption.
This content matrix determines the canvas resolution and processing capacity. Buying the screen first and designing the workflow later often creates unreadable text, excessive scaling or unused pixels.
2. Match pixel pitch to viewing distance and content
Pixel pitch is the center-to-center distance between adjacent pixels. A smaller pitch supports more pixels in the same area and improves close-range detail, but it also increases cost, processing load and the number of components.
As a practical starting point, the minimum viewing distance in meters is often close to the pixel pitch in millimeters. For example, P1.5 is commonly evaluated from about 1.5 meters or farther. This is only a screening rule: small fonts, thin map lines and dense dashboards may require a finer pitch. Test the real content at the real distance before approval.
Calculate the physical wall and native canvas together:
- Horizontal pixels = display width in millimeters / pixel pitch in millimeters.
- Vertical pixels = display height in millimeters / pixel pitch in millimeters.
- Total pixels = horizontal pixels x vertical pixels.
The selected controller must support the resulting pixel load with margin for the chosen frame rate, color depth and redundancy mode.
3. Control brightness, contrast, grayscale and color
More brightness is not automatically better indoors. Excessive luminance causes eye fatigue and reduces the visibility of dark details. Many control rooms operate within an adjustable range of roughly 300 to 800 nits, depending on ambient light, room finishes and viewing distance. Specify smooth brightness adjustment and verify grayscale performance at the normal operating level, not only at maximum output.
Calibrate white balance, gamma and color temperature across all modules. The objective is consistent interpretation of maps, warning colors and camera images from every operator position. Matte, low-reflection surfaces and controlled room lighting usually improve perceived contrast more effectively than simply raising brightness.
4. Specify refresh rate and camera compatibility
A high refresh rate reduces visible scan lines and flicker, especially when the wall is photographed or included in broadcast and video-conference feeds. For command centers, 3,840 Hz or higher is a useful procurement target when cameras may record the display. Also verify scan mode, shutter-speed compatibility, low-grayscale stability and motion performance with representative CCTV content.
Refresh rate is not the same as source frame rate. A 60 fps source can still be rendered on a high-refresh LED system; the higher refresh rate describes how frequently the LED driving system updates the pixels.
5. Design sightlines and operator ergonomics
Check the nearest and farthest viewers, console height, seated eye level and side viewing positions. Keep critical information away from the extreme top and bottom of the wall. Avoid placing fine text across a line of sight that requires repeated neck movement.
Room design should consider reflections, acoustic noise, heat, access aisles and emergency lighting. The FHWA Traffic Management Center Handbook is a useful reference for the wider operational environment, while display and AV design teams can consult relevant AVIXA standards for project-specific measurement and verification requirements.
6. Build a flexible signal-processing architecture
The processor should accept the required IP streams and physical inputs, decode the specified codecs and create multiple independent windows without visible delay or tearing. Confirm maximum input and output resolution, number of layers, scaling quality, layout recall, KVM requirements and integration with the video management system.
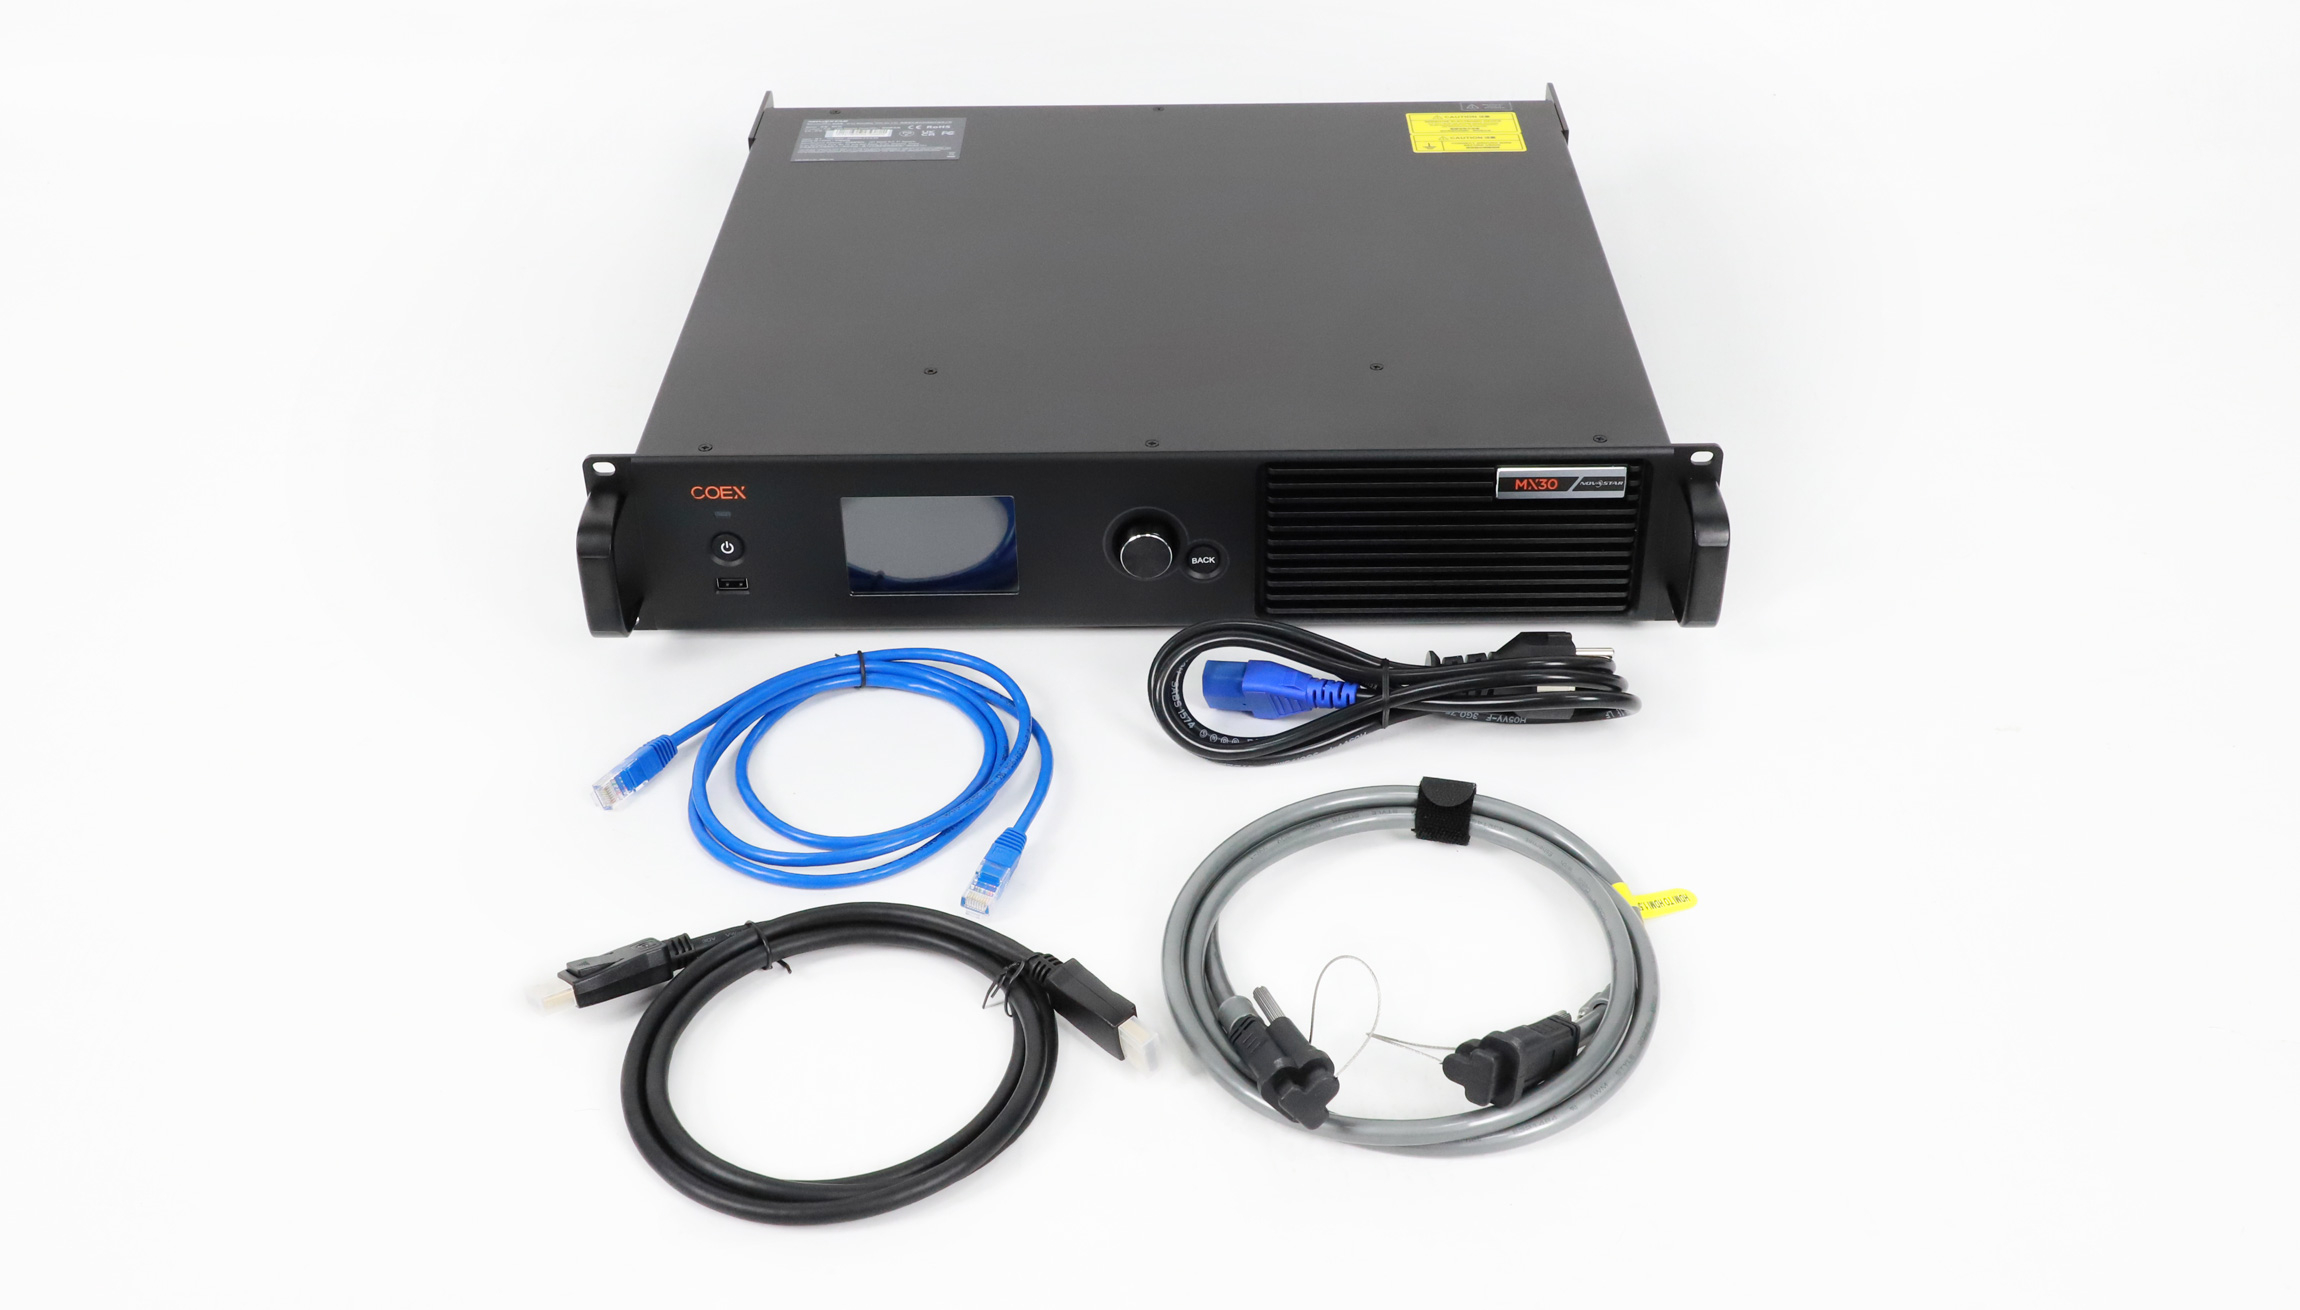
A typical path is: sources and VMS servers -> decoder or control server -> video processor -> sending device -> receiving cards -> LED modules. Management traffic, content traffic and device monitoring may need separate network segments. Use documented interfaces for alarm reporting and automated layout changes.
7. Engineer redundancy for 24/7 operation
Reliability must cover more than spare LED modules. Identify every single point of failure and define the required recovery time. Depending on the operational risk, the design may include:
- Dual power feeds, surge protection and UPS-backed control equipment.
- Redundant video inputs, controllers or processor outputs.
- Backup signal routes and automatic or operator-controlled failover.
- Hot-spare power supplies and receiving-card redundancy where supported.
- Monitoring for temperature, voltage, communication and device faults.
Failover must be tested under load. A redundant component that requires an undocumented manual reconfiguration may not meet the incident-response requirement.
8. Plan thermal management, power and noise
Estimate maximum and typical power separately. The electrical design must account for distribution, phase balance, grounding, protection, UPS capacity and safe isolation for maintenance. The HVAC calculation should use realistic heat output for the normal content and brightness profile, with margin for degraded cooling conditions.
Front-service modules can reduce the rear access requirement, but technicians still need safe working space and a clear replacement procedure. Fan noise from processors, power supplies and equipment racks should be evaluated at operator positions.
9. Design for maintenance, monitoring and lifecycle cost
Specify front or rear service access, module replacement time, calibration procedure, spare-part quantity and expected support period. Record module batches and calibration data so replacements can be matched to the existing wall. Include remote health monitoring and a maintenance log.
Lifecycle cost should include energy, cooling, spares, calibration, support and planned component replacement. The least expensive initial configuration can become costly if it requires frequent access or cannot be expanded when source counts increase.
Traffic control center LED display specification starting points
The following values are planning ranges, not universal pass/fail limits. Final requirements should be confirmed with real content in the finished room.
| Parameter | Practical starting point | Why it matters |
|---|---|---|
| Pixel pitch | P0.9-P1.8 for many close-view control rooms | Controls text, map-line and camera detail at the nearest seat |
| Indoor brightness | Adjustable, often 300-800 nits | Balances readability, dark detail and operator comfort |
| Refresh rate | 3,840 Hz or higher when cameras may capture the wall | Reduces scan lines and visible flicker |
| Grayscale | Verify at normal operating brightness | Preserves detail in dark CCTV scenes and shaded maps |
| Viewing angle | Validate from all staffed positions | Prevents color and brightness shifts at side consoles |
| Processing headroom | Capacity above calculated pixel and layer load | Supports layouts, scaling and future sources without overload |
| Service access | Front or rear access defined in the room plan | Shortens repair time and avoids unsafe work |
| Redundancy | Based on a documented single-point-of-failure review | Links the design to the required recovery time |
LED vs. LCD and DLP video walls
| Technology | Main strengths | Main design considerations |
|---|---|---|
| Fine-pitch LED | Seamless canvas, flexible size, high brightness, wide viewing angle | Pixel pitch, calibration, low-brightness image quality, heat and component count |
| LCD video wall | High pixel density, predictable panel format, familiar servicing | Visible bezels, panel-to-panel uniformity and fixed aspect ratios |
| DLP rear projection | Stable geometry and long-established control-room use | Cabinet depth, optical maintenance, room footprint and replacement availability |
Fine-pitch LED is often preferred when a seamless canvas, flexible aspect ratio and wide viewing angle are priorities. LCD or DLP may remain appropriate where very high pixel density, existing infrastructure or lifecycle constraints dominate. The best technology for a traffic control center LED display follows the content and room study, not a technology label.
Traffic control center LED display implementation workflow
- Survey the room: record dimensions, ambient light, viewing positions, structure, power, HVAC and access.
- Build the source and content matrix: document formats, resolutions, layouts, priorities and security boundaries.
- Model the display: calculate physical size, pitch, native resolution, controller load and sightlines.
- Prototype with real content: review CCTV, GIS, alarms and small text at representative distances and brightness.
- Test redundancy and monitoring: simulate source, network, processor, controller and power failures.
- Commission and document: save calibration data, layouts, network diagrams, spares and maintenance procedures.
Traffic control center LED display acceptance checklist
- No dead pixels, visible seams, abnormal modules or distracting color differences at normal viewing distance.
- All source types, window layouts and operator presets work at the required resolution and frame rate.
- Small text, map lines, alarm colors and dark CCTV details remain readable at normal brightness.
- No objectionable flicker, scan lines, tearing or latency under representative camera and workload tests.
- Redundant paths switch within the agreed recovery time and generate a clear alarm.
- Maximum and typical power, temperature and acoustic levels remain within the approved design limits.
- A trained technician can replace a module, power supply and receiving card using the documented access method.
- Configuration backups, calibration files, drawings, spare parts and support contacts are handed over.
Frequently asked questions
What pixel pitch is best for a traffic control center LED display?
There is no single best pitch. Many close-view control rooms evaluate P0.9 to P1.8, but the decision should be based on the nearest viewing distance, smallest text, map detail, wall size and budget. A full-scale content test is more reliable than a pitch-only rule.
How bright should a traffic control center LED display be?
It should be bright enough to preserve contrast in the room without causing eye fatigue. An adjustable range around 300 to 800 nits is a common starting point, but ambient light and surface reflections determine the final operating level.
Is a 3,840 Hz refresh rate necessary?
It is especially useful when cameras, broadcast systems or video conferences capture the display. For operator-only viewing, the required value can differ, but flicker and low-grayscale performance should still be verified with the intended content.
What redundancy should a 24/7 LED wall include?
Redundancy should follow a single-point-of-failure review. Common measures include dual power, UPS support, backup inputs and signal routes, redundant controllers or processor outputs, and monitored spare power or receiving-card paths.
Can an existing LCD or DLP wall be replaced with LED?
Often yes, but the structure, electrical load, cooling, access space, room acoustics and source resolution must be checked. A seamless LED wall may change the ideal aspect ratio and therefore the processor and layout design.
How should a traffic center LED display be maintained?
Use scheduled visual inspections, alarm review, cleaning, calibration checks and configuration backups. Keep matched spare modules, power supplies and receiving cards, and test the documented replacement and failover procedures periodically.
Conclusion
A successful traffic control center LED display is a coordinated operational system. The display canvas, video processing, control network, power, cooling, redundancy and maintenance plan must all support the same workflows and recovery targets. Define measurable requirements, prototype with real traffic content and verify every critical path before final acceptance.